The database creates reports with individual or grouped reports.
Report 1 & 2 show normalized values for ISNCSCI, SCIM, WISCI and 3 walk tests
during the different exam stages (very acute to chronic).
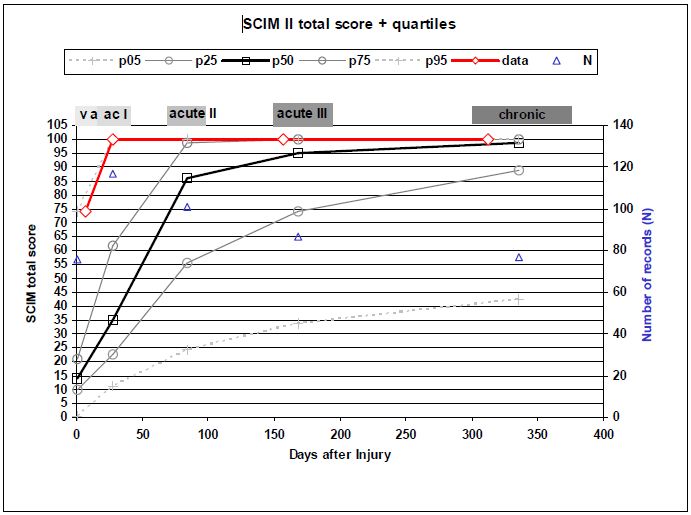
Report 3 shows a patient's individual data curve for the SCIM (red line) and the
values for a comparision group (black = median, solid grey = quartiles, dotted
grey = range).
Report 1 & 2
Patient: 2011 / Short: pr / Sex: m / DOI: 26.08.2002 / Lesion of Lesion: cervical 4
Report 3
Patient: 2011 / Short: pr / Sex: m / DOI: 26.08.2002 / Inital AIS: D / Inital NLI: C5
Precentiles from sub group: AIS_min: D / AIS_max: D / NLI_min: C4 / NLI_max: C5